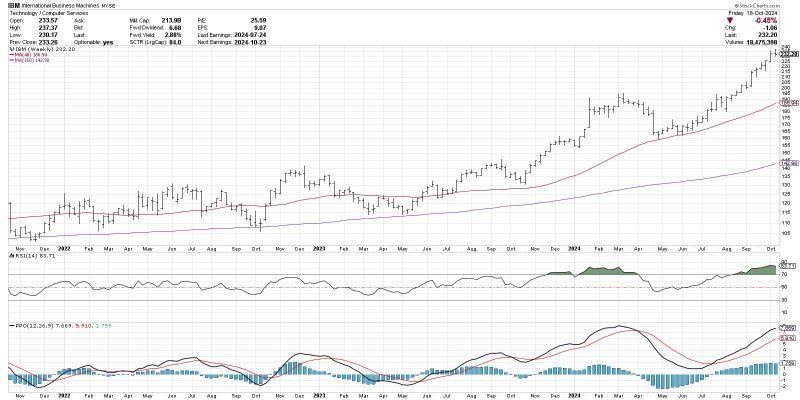
The MACD Histogram: A Powerful Tool for Anticipating Trend Changes
Understanding and predicting the direction of financial markets is a challenging yet crucial aspect of trading and investing. With the rise of technical analysis tools, traders are constantly on the lookout for indicators that can help them anticipate market trends and make profitable decisions. One such tool that has gained popularity among traders is the MACD Histogram.
The MACD Histogram is a derivative of the Moving Average Convergence Divergence (MACD) indicator, which is widely utilized by traders to identify trends and potential buy or sell signals in the market. The MACD Histogram, in particular, provides a visual representation of the difference between the MACD line and the Signal line – offering insights into the strength of a trend and potential trend changes.
One of the key benefits of using the MACD Histogram is its ability to reveal hidden signals that may not be evident when analyzing the MACD line or Signal line individually. By plotting the difference between these two lines, traders can pinpoint potential divergence points where the histogram moves away from the zero line, indicating a shift in momentum and a possible trend reversal.
Additionally, the MACD Histogram can be used in conjunction with other technical indicators or chart patterns to confirm signals and avoid false alarms. Traders often look for convergence or divergence between the MACD Histogram and the price chart to validate potential trade setups and increase the probability of success.
Moreover, the MACD Histogram is versatile and can be customized based on a trader’s preferences and trading style. By adjusting the parameters of the MACD indicator, such as the faster and slower moving averages or the smoothing period, traders can fine-tune the sensitivity of the histogram to suit different time frames and trading strategies.
While the MACD Histogram can be a powerful tool for anticipating trend changes, it is essential for traders to exercise caution and consider other factors before making trading decisions solely based on this indicator. Market conditions, volume analysis, and fundamental factors should also be taken into account to validate signals generated by the MACD Histogram and mitigate risks associated with blind trading decisions.
In conclusion, the MACD Histogram holds the potential to be a valuable ally for traders seeking to anticipate trend changes and make informed trading decisions. By understanding its mechanics, interpreting signals effectively, and using it in conjunction with other technical tools, traders can harness the power of the MACD Histogram to navigate the dynamic landscape of financial markets and stay ahead of the curve.
