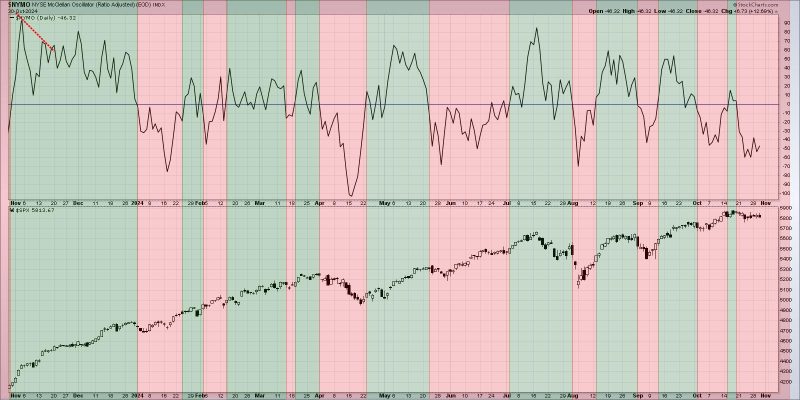
Breadth Divergences: Understanding Their Significance in Market Analysis
Diving deeper into market analysis, it is essential to comprehend the concept of breadth divergences and the potential implications they may have on market trends. Breadth divergences serve as a crucial indicator for investors and analysts, offering insights into underlying market conditions beyond just the performance of prominent indices.
Breadth divergences refer to the discrepancies between the movements of individual stocks or sectors within a market and the broader market indices. In simpler terms, it explores whether the majority of stocks are participating in a market rally or decline, or if only a select few are driving the movement.
These divergences can present themselves in various forms. For instance, a positive breadth divergence occurs when a market index, such as the S&P 500, is making new highs, while a significant number of individual stocks are not reaching new peaks. Conversely, a negative breadth divergence arises when the market index is declining, yet a majority of underlying stocks are not experiencing as significant a drop.
Understanding these breadth divergences is essential as they can provide valuable insights into the sustainability and strength of a market trend. When a market rally is supported by a broad participation of stocks, it indicates a healthier and more robust market environment. In contrast, a rally led by only a few stocks or sectors may be less sustainable and prone to correction.
Moreover, breadth divergences can serve as early warning signs of potential market reversals. If a market index continues to climb while fewer stocks are participating in the uptrend, it could signal underlying weakness and the possibility of a forthcoming correction. This divergence between the market index and individual stock performance can help investors anticipate shifts in market sentiment and adjust their investment strategies accordingly.
To effectively utilize breadth divergences in market analysis, investors should pay close attention to market breadth indicators, such as the Advance-Decline Line and the McClellan Oscillator. These tools can provide quantitative data on the number of advancing versus declining stocks, offering a clearer picture of market breadth and potential divergences.
In conclusion, breadth divergences play a critical role in market analysis, offering deeper insights into market trends and potential reversals. By understanding and monitoring these divergences, investors can make more informed decisions and better navigate the complexities of the financial markets. Remember, in the realm of investing, paying attention to the breadth of market participation can be just as crucial as tracking the performance of major indices.
