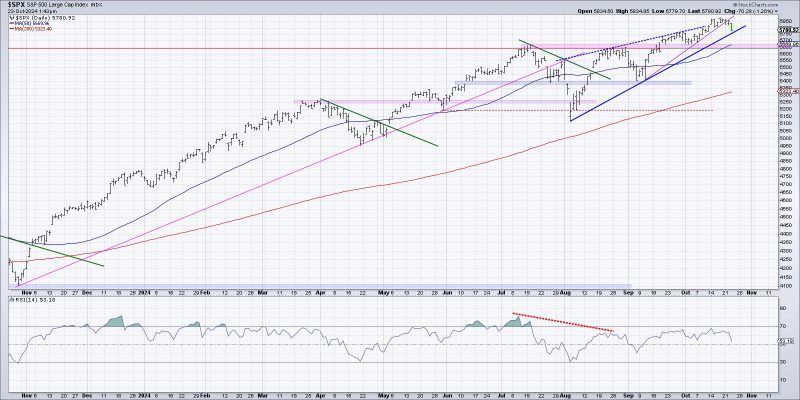
### Using Visualization Techniques to Identify Potential Distribution Phase
### Method 1: Volume Analysis
Analyzing volume is a crucial aspect when assessing potential distribution phases in the stock market. By examining the trading volume, traders can gain valuable insights into investor sentiment and market dynamics. During a distribution phase, the volume tends to increase as larger market participants unload their positions. This is often a signal that demand is decreasing, and supply is starting to overwhelm the market, possibly leading to a downturn.
### Method 2: Price Action Patterns
Price action analysis is another effective method for visualizing the start of a potential distribution phase. Traders can look for specific chart patterns that indicate a shift in market sentiment, such as head and shoulders patterns, double tops, or rising wedges. These patterns typically suggest that buyers are losing steam, and sellers are gaining control, signaling a possible distribution phase.
### Method 3: Trendline Analysis
Trendlines are valuable tools for visualizing potential distribution phases in the stock market. During a distribution phase, the price may start to form lower highs and lower lows, indicating a weakening trend. By drawing trendlines connecting these lower highs and lows, traders can visualize the downward trajectory of the stock’s price movement. This can help traders identify potential entry points for short positions or take profits on existing long positions.
In conclusion, by utilizing volume analysis, price action patterns, and trendline analysis, traders can effectively visualize the start of a potential distribution phase in the stock market. These visualization techniques provide valuable insights into market dynamics and investor sentiment, helping traders make informed decisions and navigate market trends with confidence.
