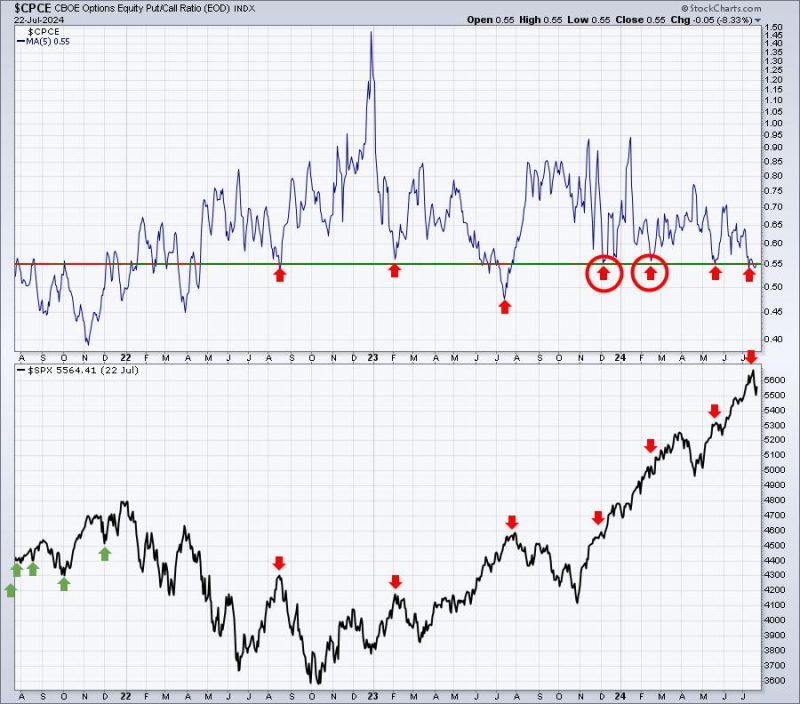
In the world of investing, trying to predict market bottoms is a challenging task that many investors grapple with. Market bottoms represent a turning point in the market cycle, signaling a potential reversal from a downtrend to an uptrend. For investors looking to capitalize on potential opportunities at market bottoms, analyzing key indicators and charts can provide valuable insights. In this article, we will explore three essential charts that investors should watch when attempting to gauge whether we have bottomed in the market.
Chart 1: Price Action and Support Levels
One of the fundamental indicators to consider when assessing market bottoms is price action and support levels. Price action refers to the movement of a security’s price over a specific period, with support levels representing points at which a security’s price tends to find buying interest and bounce higher. By analyzing price charts, investors can identify potential support levels that may indicate a bottom in the market.
In the context of market bottoms, investors should pay close attention to how prices react at key support levels. A decisive bounce off a support level accompanied by increasing buying interest could suggest that a market bottom is in place. On the contrary, a breach of critical support levels with high selling volume may indicate further downside potential.
Chart 2: Volume Analysis
Volume analysis plays a crucial role in confirming market bottoms. Volume refers to the quantity of shares traded in a security over a specific period, with high volume typically indicating strong investor participation. When assessing market bottoms, investors should look for signs of increasing volume on potential reversal days.
A spike in trading volume on days when prices begin to recover can signal that buyers are stepping in and potentially reversing the downtrend. Additionally, analyzing volume patterns leading up to the potential bottom can provide valuable insights into investor sentiment and participation. A divergence between price movements and volume trends may indicate a weakening trend that could precede a market bottom.
Chart 3: Sentiment Indicators
Sentiment indicators are valuable tools for gauging market bottoms as they provide insights into investor psychology and market sentiment. Contrarian indicators such as the put/call ratio, investor surveys, and sentiment indexes can offer contrarian signals when sentiment reaches extreme levels.
During periods of market bottoms, investor sentiment tends to be pessimistic, with many investors fearful of further downside. Contrarian investors often view extreme pessimism as a potential buying opportunity, as markets have historically exhibited a tendency to recover after reaching sentiment extremes. Monitoring sentiment indicators can help investors identify when market sentiment has reached capitulation levels, potentially signaling a market bottom.
In conclusion, identifying market bottoms is a complex endeavor that requires a comprehensive analysis of multiple indicators and charts. By closely monitoring price action, volume patterns, and sentiment indicators, investors can gain valuable insights into potential market bottoms and position themselves for potential opportunities. While no single indicator can accurately predict market bottoms with certainty, a holistic approach to chart analysis can enhance investors’ ability to navigate volatile market conditions effectively.
